Purpose
Showcase Power Bi mastery including DAX functions for Month to Date calculations, DAX tables for top 3 values, visuals with drill down and slicing functionality, bookmarks for navigation, a glossary and accompanying documentation.
I typically avoid as many DAX tables as possible by performing all transformations in a pipeline / SSIS package / miscellaneous data transformation on the server side, but I wanted to include one Power Bi in my portfolio that uses Import instead of Direct Query so that it would load faster.
Instead of using real data, I created sample spreadsheets for Import.
Data Architecture
Instead of using real data, I created sample spreadsheets for Import.
Power Bi
This Power Bi uses Imported Data so that it is rendered quicker and cannot be refreshed.
Power Bi – Tabs
Index – Pages listing Bookmarks to all pages.
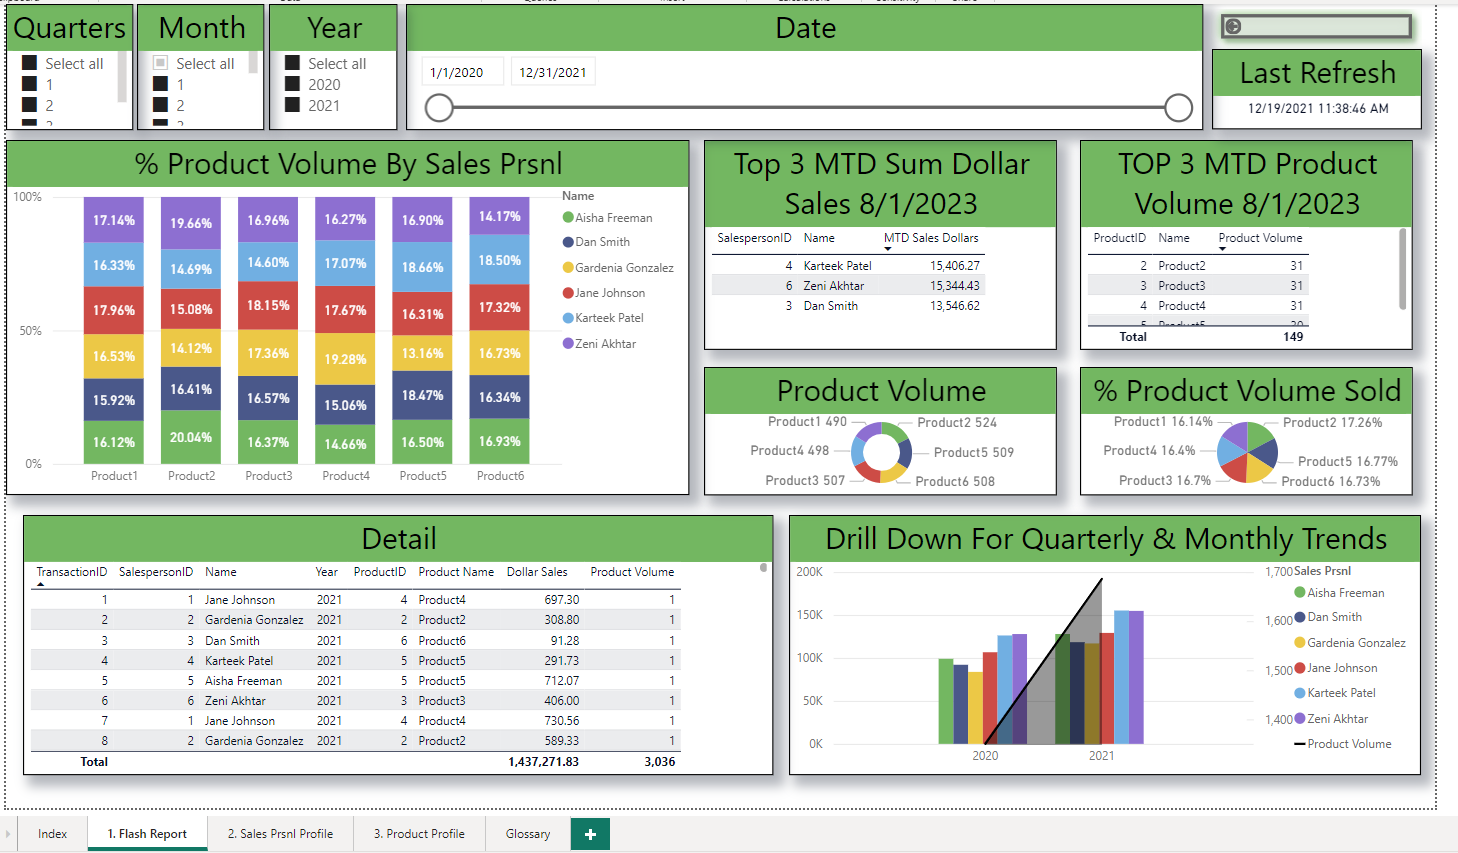
- Flash Report – Snapshot of Sales by Prsnl and Products for a selected period of time. Includes a leaderboard for Prsnl and Products sold.
- Sales Prnsl Profile – Snapshot of Prsnl acheivements for a specified time period.
- Product Profile – Snapshot of Products sold for a specified time period.
- Glossary – Definitions of fields displayed within reports.
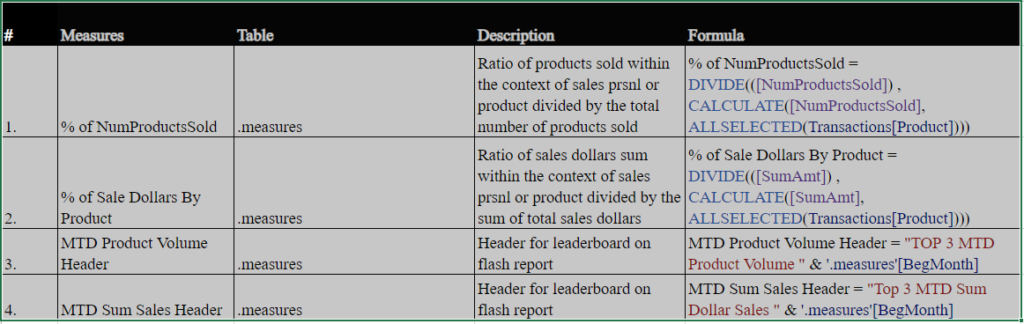
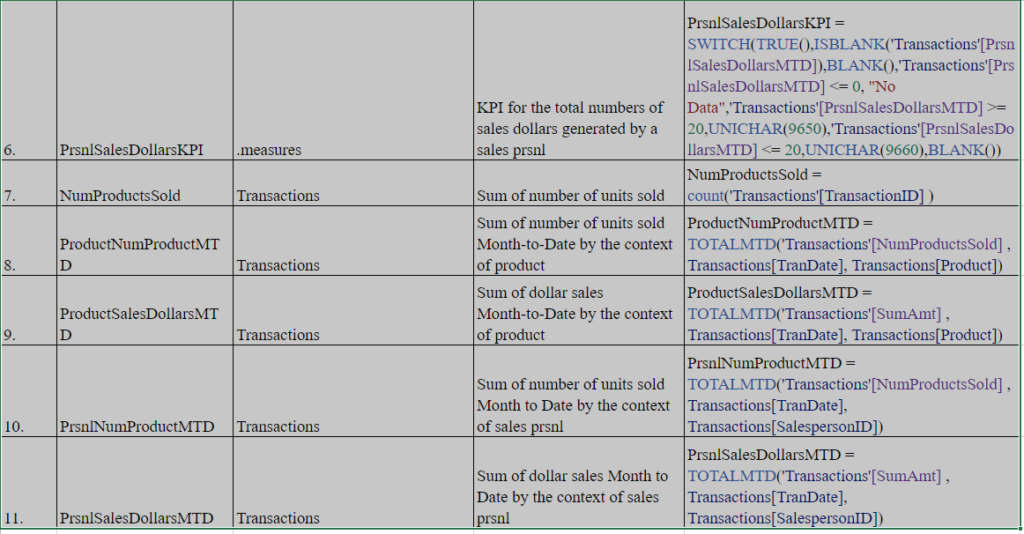
Power Bi – Measures
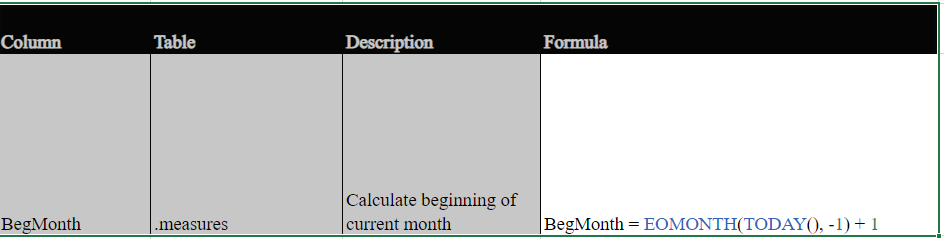
Power Bi – Calculated Columns